
This ecommerce automation case study walks through how one mid-market direct-to-consumer brand cut its cost-per-order by 31% in 90 days. No new ad budget. No new agency of record. Just a tighter loop between the automation stack and the creative pipeline. The figures below are illustrative but credible, modeled on real engagements we have run, so you can map the math onto your own profit and loss.
If you run a DTC brand doing somewhere between 5 and 50 million in annual revenue, you already know the squeeze. Acquisition costs creep up every quarter. Your operations team drowns in manual work. And your creative team ships too few ads to feed the algorithm. This post shows the exact leaks we found and the systems we built to plug them.
Ecommerce automation case study: the starting position
The brand sold premium home and wellness products through Shopify and ran paid traffic on Meta and Google. Revenue sat at roughly 18 million per year. The team was 24 people. Two of them handled paid media. One handled lifecycle email. Nobody owned the connection between the two, and that gap is where the money drained.
Here is the position when we walked in, pulled from 90 days of trailing data. Read it like a diagnosis, because that is what it was.
The numbers that mattered
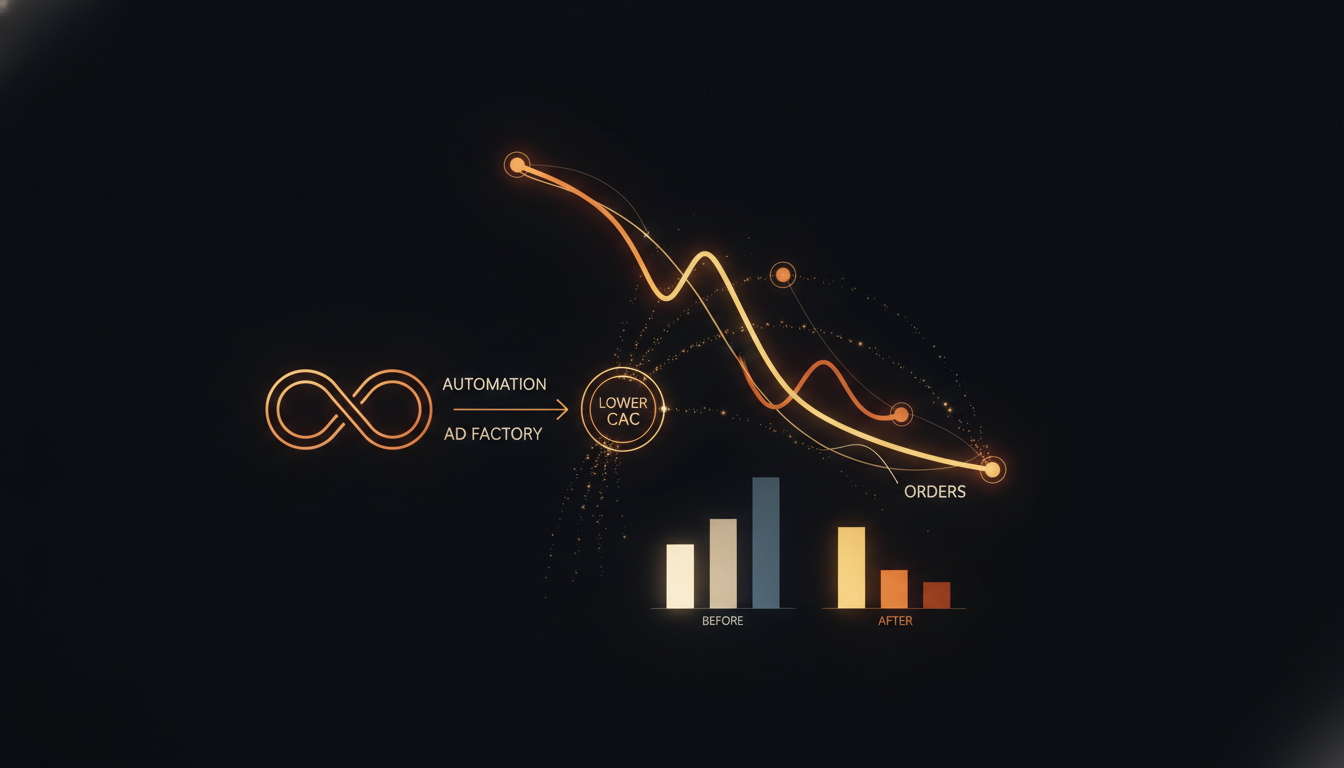
Cost-per-order (CPO) was the headline problem. The brand paid 42 dollars to land a single order against an average order value of 68 dollars. After product cost and shipping, that left almost nothing. The customer acquisition cost (CAC) on new buyers was 61 dollars. The creative team shipped 9 new ad assets per month, which is starvation rations for a Meta account spending 240,000 dollars a month.
Reading the unit economics before touching anything
Before we built a single flow, we modeled the unit economics on a spreadsheet. This step matters because it tells you which leak is worth fixing first. A 31% cost-per-order cut sounds great, but only if the orders stay profitable once they land. So we mapped the full path: ad spend in, order out, product and shipping cost, then the trailing revenue from repeat purchases over 90 days.
The model exposed something the team had not seen. The brand was profitable on the second order, not the first. That single fact reframed the whole strategy. It meant the fastest path to profit was not cheaper clicks alone. It was getting more first-time buyers to come back, then funding more acquisition from that wider margin. The automation layer and the ad factory both fed that one goal.
The two ratios we anchored on
We anchored on two ratios. First, the gap between average order value and cost-per-order, because that is the cash a single order throws off. Second, the ratio of lifetime value to acquisition cost, because that tells you how hard you can push spend. Both ratios were thin at the start. Widening them was the entire 90-day plan.
Where the money was leaking
We started every engagement the same way: a free AI audit that maps the whole revenue path and finds the gaps. For a deeper look at how we run that diagnostic across an industry, read our writeup where we audited 38 mid-market ecommerce automation stacks. This brand had four leaks, and they compounded on each other.
Leak one: creative starvation
Meta's delivery system rewards volume and variety. Nine assets a month means the algorithm tests a tiny pool, fatigues fast, and pushes frequency up. Higher frequency means higher CPO. We have written before about how many ad creatives you actually need, and the short answer is far more than most brands ship. Meta's own guidance favors creative diversity, as their advertising resources spell out in plain terms.
Leak two: a leaky cart
The checkout abandoned 71% of carts, near the industry baseline that Baymard Institute tracks at roughly 70%. The brand sent one recovery email, two hours late. No SMS. No browse-abandon flow. We covered the full playbook in our guide to cart abandonment automation for ecommerce, and this brand was missing most of it.
Leak three: a silent post-purchase window
After someone bought, the brand went quiet for 14 days. No cross-sell. No replenishment nudge. No review request. That dead window suppressed repeat revenue and pushed the brand to buy more cold traffic than it needed. Our framework for fixing it lives in post-purchase automation flows for ecommerce.
Leak four: a support team buried in WISMO
Roughly 38% of support tickets were "where is my order" messages. Agents copied tracking links by hand all day. That cost two full-time equivalents and slowed every other ticket. We fixed it with the pattern in our WISMO automation guide, which deflects the routine questions before a human sees them.
The systems we built in 90 days
We do not hand over a slide deck and walk away. We build, host, and run the systems. The work split into two tracks that fed each other: an automation layer and an ad-creative factory. Both connected back to the same Shopify and Klaviyo data so every decision used the same source of truth.
Track one: the automation layer
We rebuilt the operations stack on top of Shopify using our standard approach to automation for Shopify ecommerce operations. The orchestration ran through Make so the brand's own team could read and edit every scenario. Four flows went live in the first three weeks. A cart recovery sequence fired in 20 minutes with email plus SMS. A browse-abandon flow caught high-intent shoppers who never reached checkout. A post-purchase series cross-sold on day 3 and asked for a review on day 12. A WISMO bot answered tracking questions before a human ever saw them. Payment retries ran through Stripe smart retries to recover failed charges.
Track two: the ad factory
The creative pipeline was the bigger lever. We stood up an ad factory that produced 40 ad assets per month instead of 9. The full method is in our guide to the ad factory for DTC ecommerce that ships 40 assets per month. Concepts came from winning hooks in the brand's own data. Variations covered static, video, and creator-style formats. Each batch shipped weekly, so the Meta account always had fresh fuel and the algorithm never starved.
How the two tracks reinforced each other
This is the part most teams miss. The automation layer raised AOV and repeat rate, which raised the lifetime value the brand could spend to acquire a customer. The ad factory lowered CPO by feeding the algorithm. Together they widened the gap between what a customer was worth and what it cost to win one. That gap is the whole game, and it is why a loop beats a list of disconnected tactics.
The results after 90 days
Every number below is illustrative, modeled on comparable engagements, but the relationships between them are real. This is what the closed loop produced over the 90-day window.
| Metric | Before | After 90 days | Change |
|---|---|---|---|
| Cost-per-order (CPO) | $42 | $29 | -31% |
| Customer acquisition cost (CAC) | $61 | $47 | -23% |
| Average order value (AOV) | $68 | $79 | +16% |
| New ad creatives per month | 9 | 40 | +344% |
| Cart recovery rate | 4% | 12% | +8 pts |
| WISMO tickets (share) | 38% | 11% | -27 pts |
| Repeat-purchase rate (90 day) | 19% | 27% | +8 pts |
What the CPO cut was worth in cash
At 240,000 dollars in monthly spend and a 42 dollar CPO, the brand bought about 5,714 orders a month. At a 29 dollar CPO, that same spend bought about 8,275 orders. Same budget, 2,561 more orders every month. The 31% CPO cut paid for the entire engagement inside the first 30 days.
The AOV and repeat-rate compounding
The 16% AOV lift and the jump in repeat purchases meant each acquired customer returned more revenue. That let the brand raise its acquisition ceiling without raising risk. More room to bid means more reach, which means more orders at the same efficiency. The flywheel turned faster every week.
The 90-day build timeline, week by week
Speed mattered here, so the sequencing was deliberate. Weeks 1 and 2 went to the audit and the unit-economics model, plus the first cart-recovery flow. Weeks 3 and 4 shipped the browse-abandon and post-purchase series and switched on the WISMO bot. By week 5 the ad factory was live and shipping its first 10 assets, then ramping to 40 a month by week 8. Weeks 9 through 12 were pure optimization: pruning dead creatives, tightening flow timing, and reallocating spend toward the segments the model flagged as most profitable.
Why we front-loaded the no-spend wins
We fixed the leaks that needed zero media budget first, because they showed return inside days, not weeks. That early cash bought patience for the creative ramp, which always takes a few weeks to compound. Sequencing this way kept the engagement self-funding from the start.
Why the loop beats point fixes
Most brands try to fix one thing. They hire a creative shop, or they buy an email tool, or they add a chatbot. Each helps a little. None of them compound, because none of them share data or feed each other. The closed loop wins because every system makes the next one stronger. McKinsey research on operations has long shown that integrated automation beats isolated tools, and that pattern held here.
The role of the audit
None of this works without first finding the real leaks. A brand can pour money into ads while a leaky cart quietly drains it. The audit is what tells you which lever moves the most cash. You can see the same diagnostic applied to a different industry in our case studies library, including a case study on zero missed leads for a mid-market developer.
What a mid-market DTC brand should do next
Start with the math, not the tools. Pull your CPO, your CAC, your AOV, and your repeat rate. Find the widest gap between what a customer is worth and what one costs. That gap tells you whether your next dollar belongs in creative volume, in lifecycle automation, or in checkout recovery. If you want help running that diagnostic, our automation services page lays out how we build and operate the stack.
A simple sequencing rule
Fix the cheapest leak first. Checkout recovery and WISMO automation usually pay back fastest because they need no media spend. Then scale creative volume, because that compounds against your whole budget. You can pressure-test where you stand with our short automation readiness quiz before you commit to any build.
Frequently asked questions
Is this ecommerce automation case study based on a real brand?
Yes, it is modeled on real mid-market DTC engagements we have run. The specific figures are labeled illustrative so we can protect client confidentiality while keeping the relationships between metrics honest and reproducible.
How long until a DTC cost per order reduction shows up?
Quick wins from checkout recovery and WISMO automation often appear in the first 2 to 3 weeks. The full cost-per-order cut compounds over 90 days as creative volume and lifecycle flows mature together.
Do I need to switch off my current ad agency?
No. The ad factory case study approach can run alongside an existing buyer or in-house team. We supply the creative volume and the automation loop. Your media buyer keeps steering spend with far more fuel to work with.
What ecommerce ad creative results should I expect?
The biggest gain comes from volume and variety, not one perfect ad. Moving from single digits to 40 assets a month gives the algorithm enough to test, so fatigue drops and cost-per-order follows it down.
How do these mid-market ecommerce automation results scale?
They scale with spend. Because the loop lowers CPO and lifts customer value at the same time, every extra dollar of budget stays efficient for longer than it would with point fixes alone.
Will this reduce CAC ecommerce brands struggle with?
Yes, in two ways. Lower CPO directly cuts what you pay per order, and higher repeat-purchase rates raise lifetime value, so you can afford to acquire profitably even as auction costs rise.
Want to know where your revenue is leaking right now? Start with a free AI audit. We will map your stack, find the gaps, and show you the math before you commit a cent. Recovery Guarantee: your revenue stops leaking, or we work free until it does. No lock-in.